7+ Key Insights Every Placement Committee and Office Needs for End-to-End Placements
The 7+ placement insights a placecom and placement office should track, from domain interest to offers, and how to act on them. ISB runs 50+ dashboards.

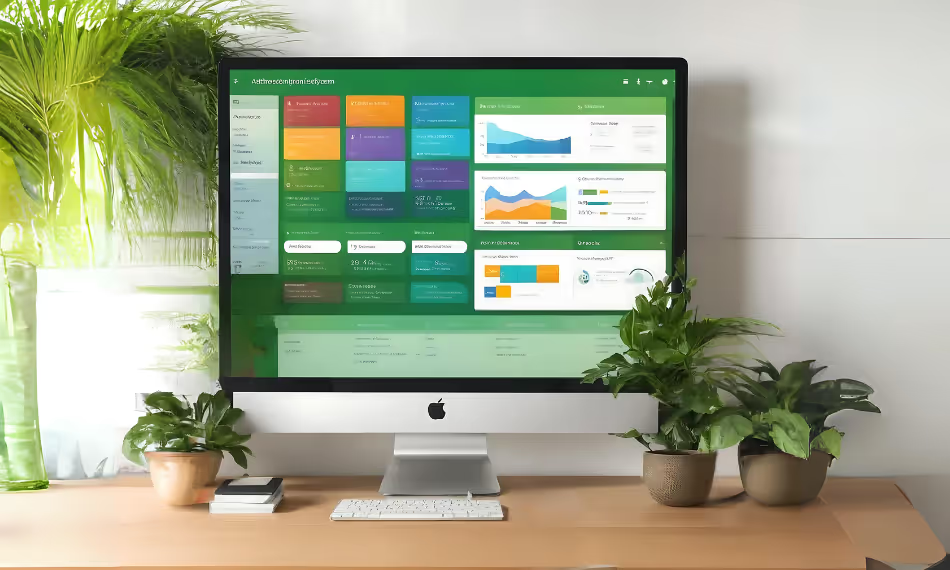
The short answer: to run placements end to end, a placement committee and placement office need seven core insights: students' domain interests, company-wise participation, profile validation status, application sizes, shortlist sizes, offer status and a view of the overall recruitment process. Reviewed day by day, they show where the season is drifting while there is still time to correct it. ISB, for example, runs its placement season with 50+ custom reports and analytics dashboards.
This article explains who uses these insights, what each one tells you, when to look at it and what to do about it. For the wider case for placement automation, including scheduling and data quality, see 3 advantages of Skynet placement automation.
Why does day-wise placement data matter?
Placement seasons rarely fail in one dramatic moment. They drift. One group of students applies narrowly and collects few shortlists. A sector with strong student interest has too few recruiters. A company's interviews keep overrunning. By the time the end-of-season report shows the pattern, the chance to act has gone.
Access to day-wise process performance data gives up-to-date insight, so corrective action can happen as soon as a process deviates. Those corrections improve the placement experience for every stakeholder in the institution. Without a connected system, the same data exists, but it is spread across spreadsheets, email threads and forms, and assembling it takes longer than the decision window allows.
Who uses placement insights?
Key process analytics dashboards serve three stakeholders, and each asks a different question of the data:
- The placements chair needs the overall picture: is the season on track, and where should attention go this week?
- The placements office team needs operational detail: which profiles are unvalidated, which companies are pending, which issues are open.
- The placement committee (placecom) needs to know which students and which recruiters to engage next.
A good dashboard is built for one of these readers. A single report that tries to serve all three usually serves none of them well.
What are the 7 key insights to track?
1. Students' work domain interest
What it tells you: the areas students want to work in, so placement activities can be tailored to them. When to look: before recruiter outreach begins, and again as interests firm up. What to do: compare student interest against the recruiters already lined up. A gap here is a gap in outreach.
2. Company-wise participation
What it tells you: how each company is participating, based on the job descriptions it has posted and the shortlists it has provided. When to look: throughout the application phase. What to do: follow up with companies that have posted JDs but not yet issued shortlists, well before placement day.
3. Student profile validation
What it tells you: which student profiles have been validated and which are still pending. When to look: early, before applications open. What to do: chase pending profiles early. An unvalidated profile is an error waiting to reach a recruiter.
4. Application size analysis
What it tells you: how many applications students are making, segmented by prior work experience and domain interest. When to look: as application windows close. What to do: check whether freshers apply as widely as experienced students, and whether any domain is under-applied, and respond before the next window.
5. Shortlist size analysis
What it tells you: how shortlists are distributed, segmented by students' domain of interest. When to look: as each company's shortlist arrives. What to do: a domain with many applications but few shortlists points to a mismatch between student profiles and recruiter expectations, which the placecom can address through mentoring or CV review.
6. Offer status
What it tells you: the status of offers made to students, segmented by domain interest. When to look: daily during the placement process. What to do: see which domains are converting, and which students are still in process and need attention.
7. The overall recruitment process
What it tells you: a holistic view of the recruitment process, from registration to offers. When to look: at a fixed rhythm through the season. What to do: this is the chair's view. It shows whether the six insights above add up to a season on track.
The "+": interview-day execution data
On interview days, a further layer matters: interview durations, start delays and live student status. It lets the office identify companies that deviate from standard interview durations and address the deviation on the day, not in the post-season review. At IIT Bombay, Skynet Scheduler provided real-time interview state tracking across all companies on Day 0, which helped the institute interview 900 students with zero schedule clashes. Read the IIT Bombay case study. For the on-the-day view in detail, see why real-time tracking on Day 0 and Day 1 is critical.
What actions should the placecom take on these insights?
Insight is only useful if it changes what the team does next. Five actions follow directly from placement process analytics:
- Engage students with low application and shortlist counts. Identify them early and support them, through mentoring, CV review or a nudge to apply more widely, to improve their chances of success.
- Monitor company interview durations. Identify companies that deviate from standard interview durations on interview days and address the deviation with the recruiter.
- Understand application behaviour. Analyse how students apply across industry domains to shape placement strategy.
- Track student participation. Monitor who is taking part in the process, along with application success and rejection metrics.
- Identify industry hotspots. Find the domains that attract the most student interest, and focus on engaging more recruiters in those areas.
Consider a placecom that notices, midway through the season, that one domain has strong student interest but few participating companies. With day-wise data, that is a prompt for outreach while recruiters can still join. Without it, the gap shows up only in the final report.
What does this look like at leading institutions?
ISB replaced its legacy placements platform in 2023 with a fully customised Skynet deployment across its Hyderabad and Mohali campuses. Limited analytics and reporting had been one of the old platform's shortfalls. The new platform delivers 50+ custom reports and analytics dashboards, fed by automated workflows for student profiles and validation, applications and shortlisting, and dream offers. Read the ISB case study.
IIM Lucknow's placement committee cited Skynet's proactive approach to understanding data requirements, and presenting them in an easy-to-consume format, as particularly valuable across every stage of the process. It reduced the grunt work for the placement team on every run. Read the IIM Lucknow case study.
"Skynet was proactive in terms of understanding the data requirements and their use cases to present them in an easy-to-consume format." Prof. Rajesh Aithal, Placement Chairperson (2019), IIM Lucknow
IIM Trichy had no placement dashboard or custom reporting before Skynet. Its deployment now includes placement dashboards and custom reports for detailed performance tracking, with role-based access control across user groups. Read the IIM Trichy case study.
How do you make placement data easy to consume?
- Capture data as a by-product of the process. When profiles, applications, shortlists, schedules and offers run through one system, the data is already there. Nobody has to compile it.
- Build each dashboard for its reader. The chair, the office and the placecom need different views.
- Review at a fixed rhythm. Day-wise during the season, so deviations are caught early.
- Control who sees what. Role-based access keeps student data secure while giving each group what it needs.
Frequently asked questions
What are placement analytics?
Placement analytics are the data a placement office and committee use to monitor and improve the placement process: domain interest, company participation, profile validation, applications, shortlists, offers and interview-day execution.
Which placement metrics matter most?
The ones that lead to action: students with low application and shortlist counts, companies deviating from agreed interview durations, and domains where student interest outstrips recruiter participation.
Who should see placement dashboards?
The placements chair, the placements office team and the placement committee, each with a view suited to their role and access controls to match.
How often should placement data be reviewed?
Day by day during the season. Day-wise process data is what allows timely corrective action when a process deviates.
Can Skynet build custom placement reports?
Yes. ISB's Skynet deployment includes 50+ custom reports and analytics dashboards, and IIM Trichy's includes placement dashboards and custom reports.
Related reading
- 3 advantages of Skynet placement automation
- Why real-time tracking on Day 0 and Day 1 is critical
- What placement challenges do students face without modern IT systems?
- Skynet Placement Automation
To discuss placement analytics and dashboards for your institution, write to us at skynet@edtex.in or request a demo.
Explore More Blogs



CIN: U74999TG2016PTC110546
GST: 36AABCW8421F1ZD
PAN: AABCW8421F